
Signal Deck: A Python Shell Inside Home Assistant
I’ve been building a thing. It started as a debugging tool and turned into something I use every day.
Signal Deck is a Lovelace card that gives you a Python REPL inside your Home Assistant dashboard. You type Python, it runs right there in the browser. No backend, no add-on, no SSH. Just a shell embedded in your dashboard.
The problem it solves
Here’s the situation I kept finding myself in.
Something would happen in my house. A light would turn on when it shouldn’t, a temperature reading would spike, an automation would fire at the wrong time. I’d open HA, stare at the entity, look at the history graph, maybe check the logbook. And then I’d think: I wish I could just query this.
Not click through menus. Not build a template sensor to see a value once. Just type something like “show me the last 6 hours of this sensor” and get an answer.
Developer Tools helps, but it’s clunky for exploration. Template editors are powerful but stateless; you can’t build up a picture incrementally. And the history graphs are fine for a glance but useless for correlation.
I wanted something closer to a Jupyter notebook. A place to poke at my home’s state interactively, build up understanding, and see results immediately.
What it actually is
Signal Deck is a custom Lovelace card. You add it to a dashboard and get a terminal-style Python shell.
The Python runs entirely in your browser via WebAssembly, specifically Monty, Pydantic’s Python-in-WASM runtime. There’s no server-side component. Your HA instance serves the card’s JavaScript and WASM files, and everything executes client-side.
Behind the Python runtime sits a Rust shell engine (also compiled to WASM) that handles command parsing, data transforms, output shaping, and the structured render specs that tell the frontend what to display.
The TypeScript layer handles the Lovelace lifecycle, WebSocket communication with HA, and rendering. It exposes a small API to the shell engine (fetch states, fetch history, call services) and renders whatever the engine produces.
Three layers, strict boundaries: TypeScript for I/O and rendering, Rust for logic and transforms, Python for user code.
What you can do with it
The basics:
# List all entities
ls()

# Filter by domain
ls("light")

# Inspect a single entity
get("sensor.living_room_temperature")

# View history as a chart
history("sensor.living_room_temperature", "6h")

# Upcoming calendar events
events("calendar.home", "24h")
The history() call returns a full ECharts time-series chart, rendered inline, auto-themed, with proper axis formatting. Not a text dump. An actual interactive chart, right in the shell.
There’s a show() function for rendering arbitrary ECharts specs if you want full control:
data = [("Solar", 3.2), ("Grid", 1.1), ("Battery", 0.4)]
show({
    "series": [{"type": "pie", "data": [{"name": n, "value": v} for n, v in data]}]
})
And entity cards that give you a formatted, glanceable view of any entity: state, attributes, last changed time, all in a compact card.
The AI analyst
This is the part that surprised me.
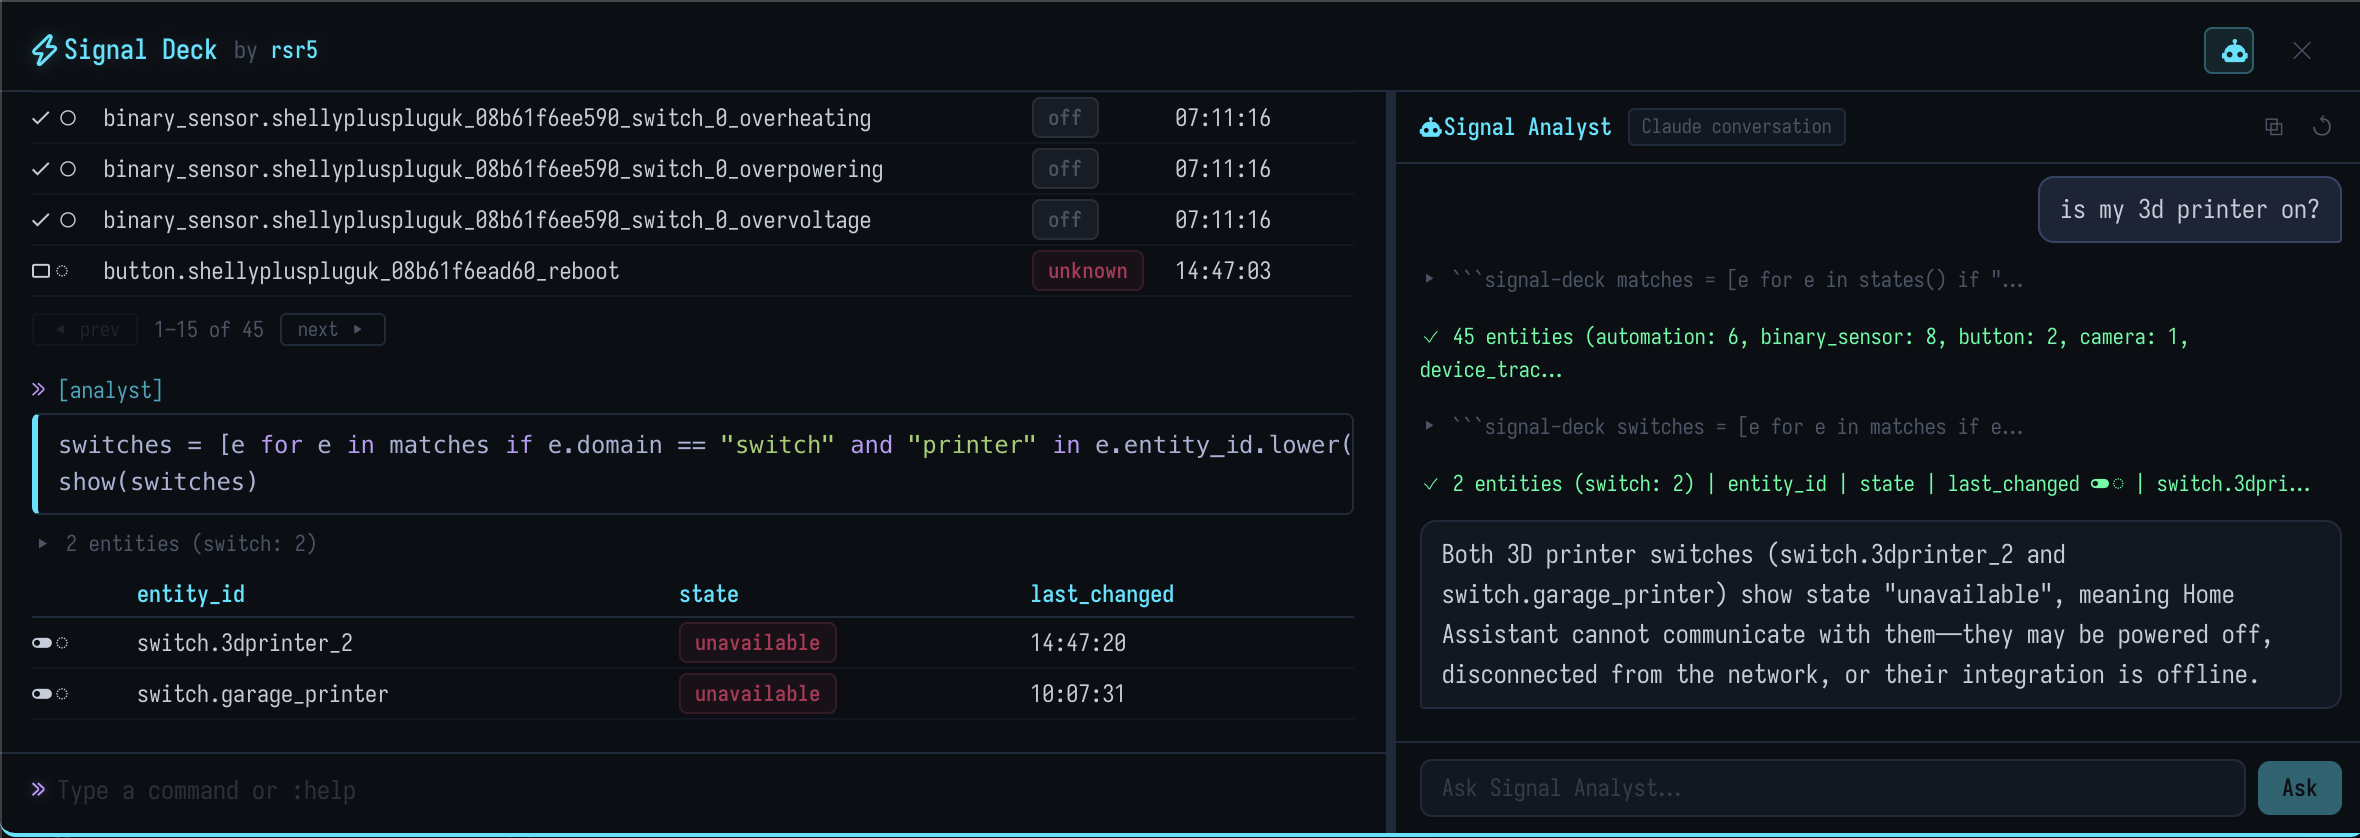
Signal Deck has a built-in AI assistant called the “Signal Analyst” that connects to whatever Conversation agent you have configured in Home Assistant. Claude, GPT, Ollama, a local model. Whatever you’re running.
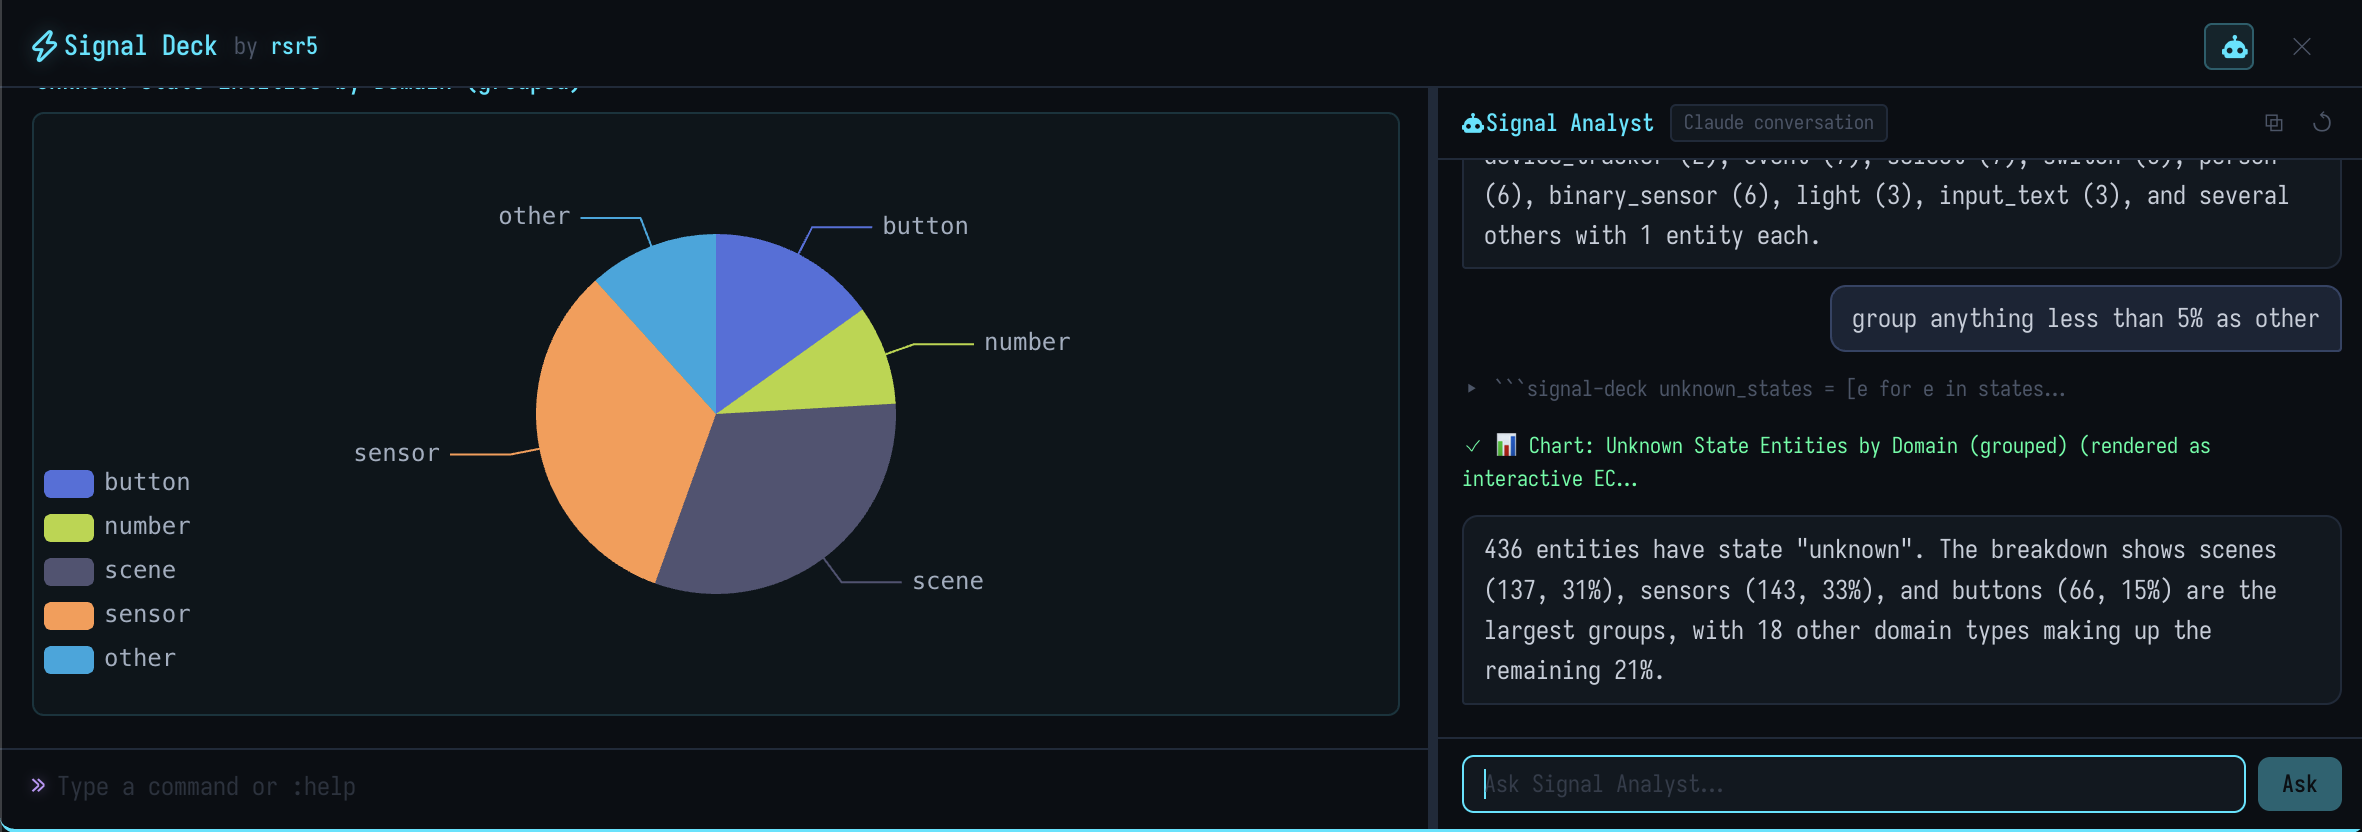
You open the analyst panel, ask a question in plain English, and it writes and executes Python against your live state. It can read entities, pull history, generate charts, and explain what it finds.
The workflow is: you ask a question → the LLM writes a Python snippet → Signal Deck executes it in the sandboxed shell → you see the result. The LLM can iterate. If the first attempt doesn’t answer the question, it can refine.
I’ve been using it for things like:
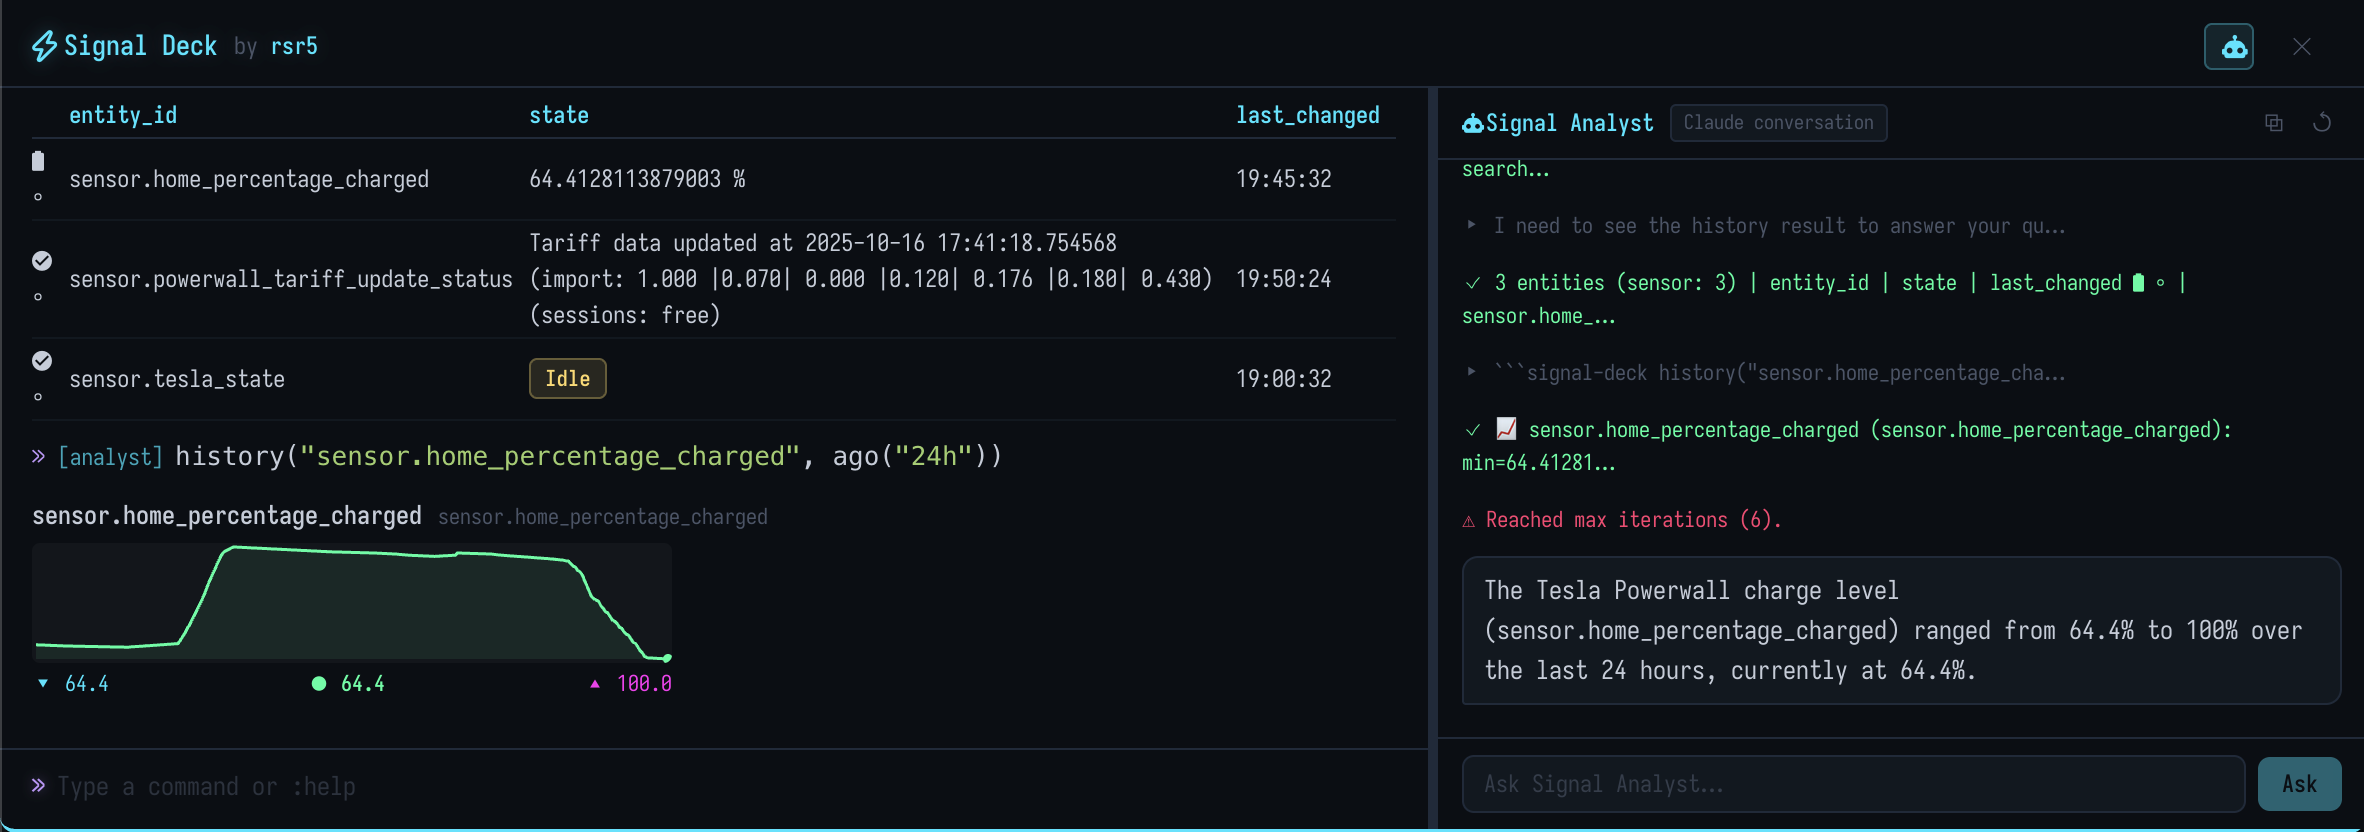
- “Why is the kitchen temperature rising?” It pulls the history, checks if heating is on, looks at door sensors
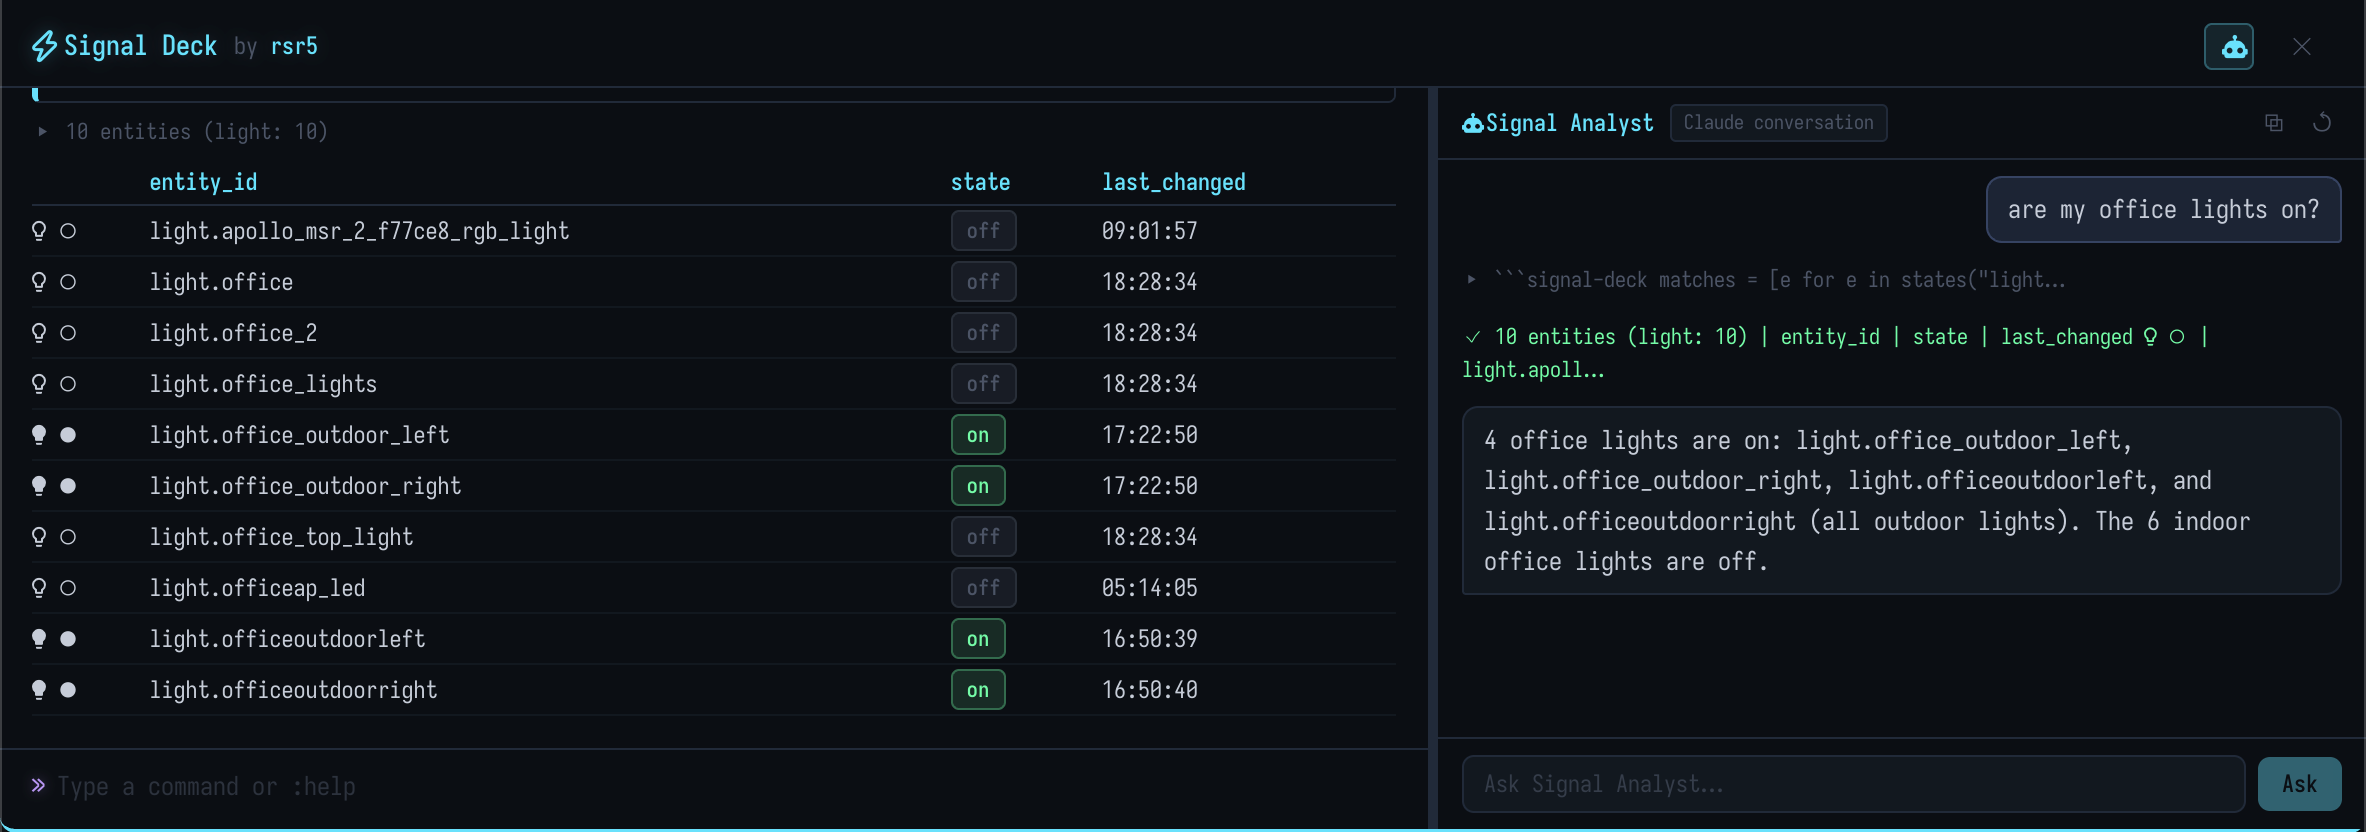
- “Which lights are on right now?” It queries all light entities and formats a table
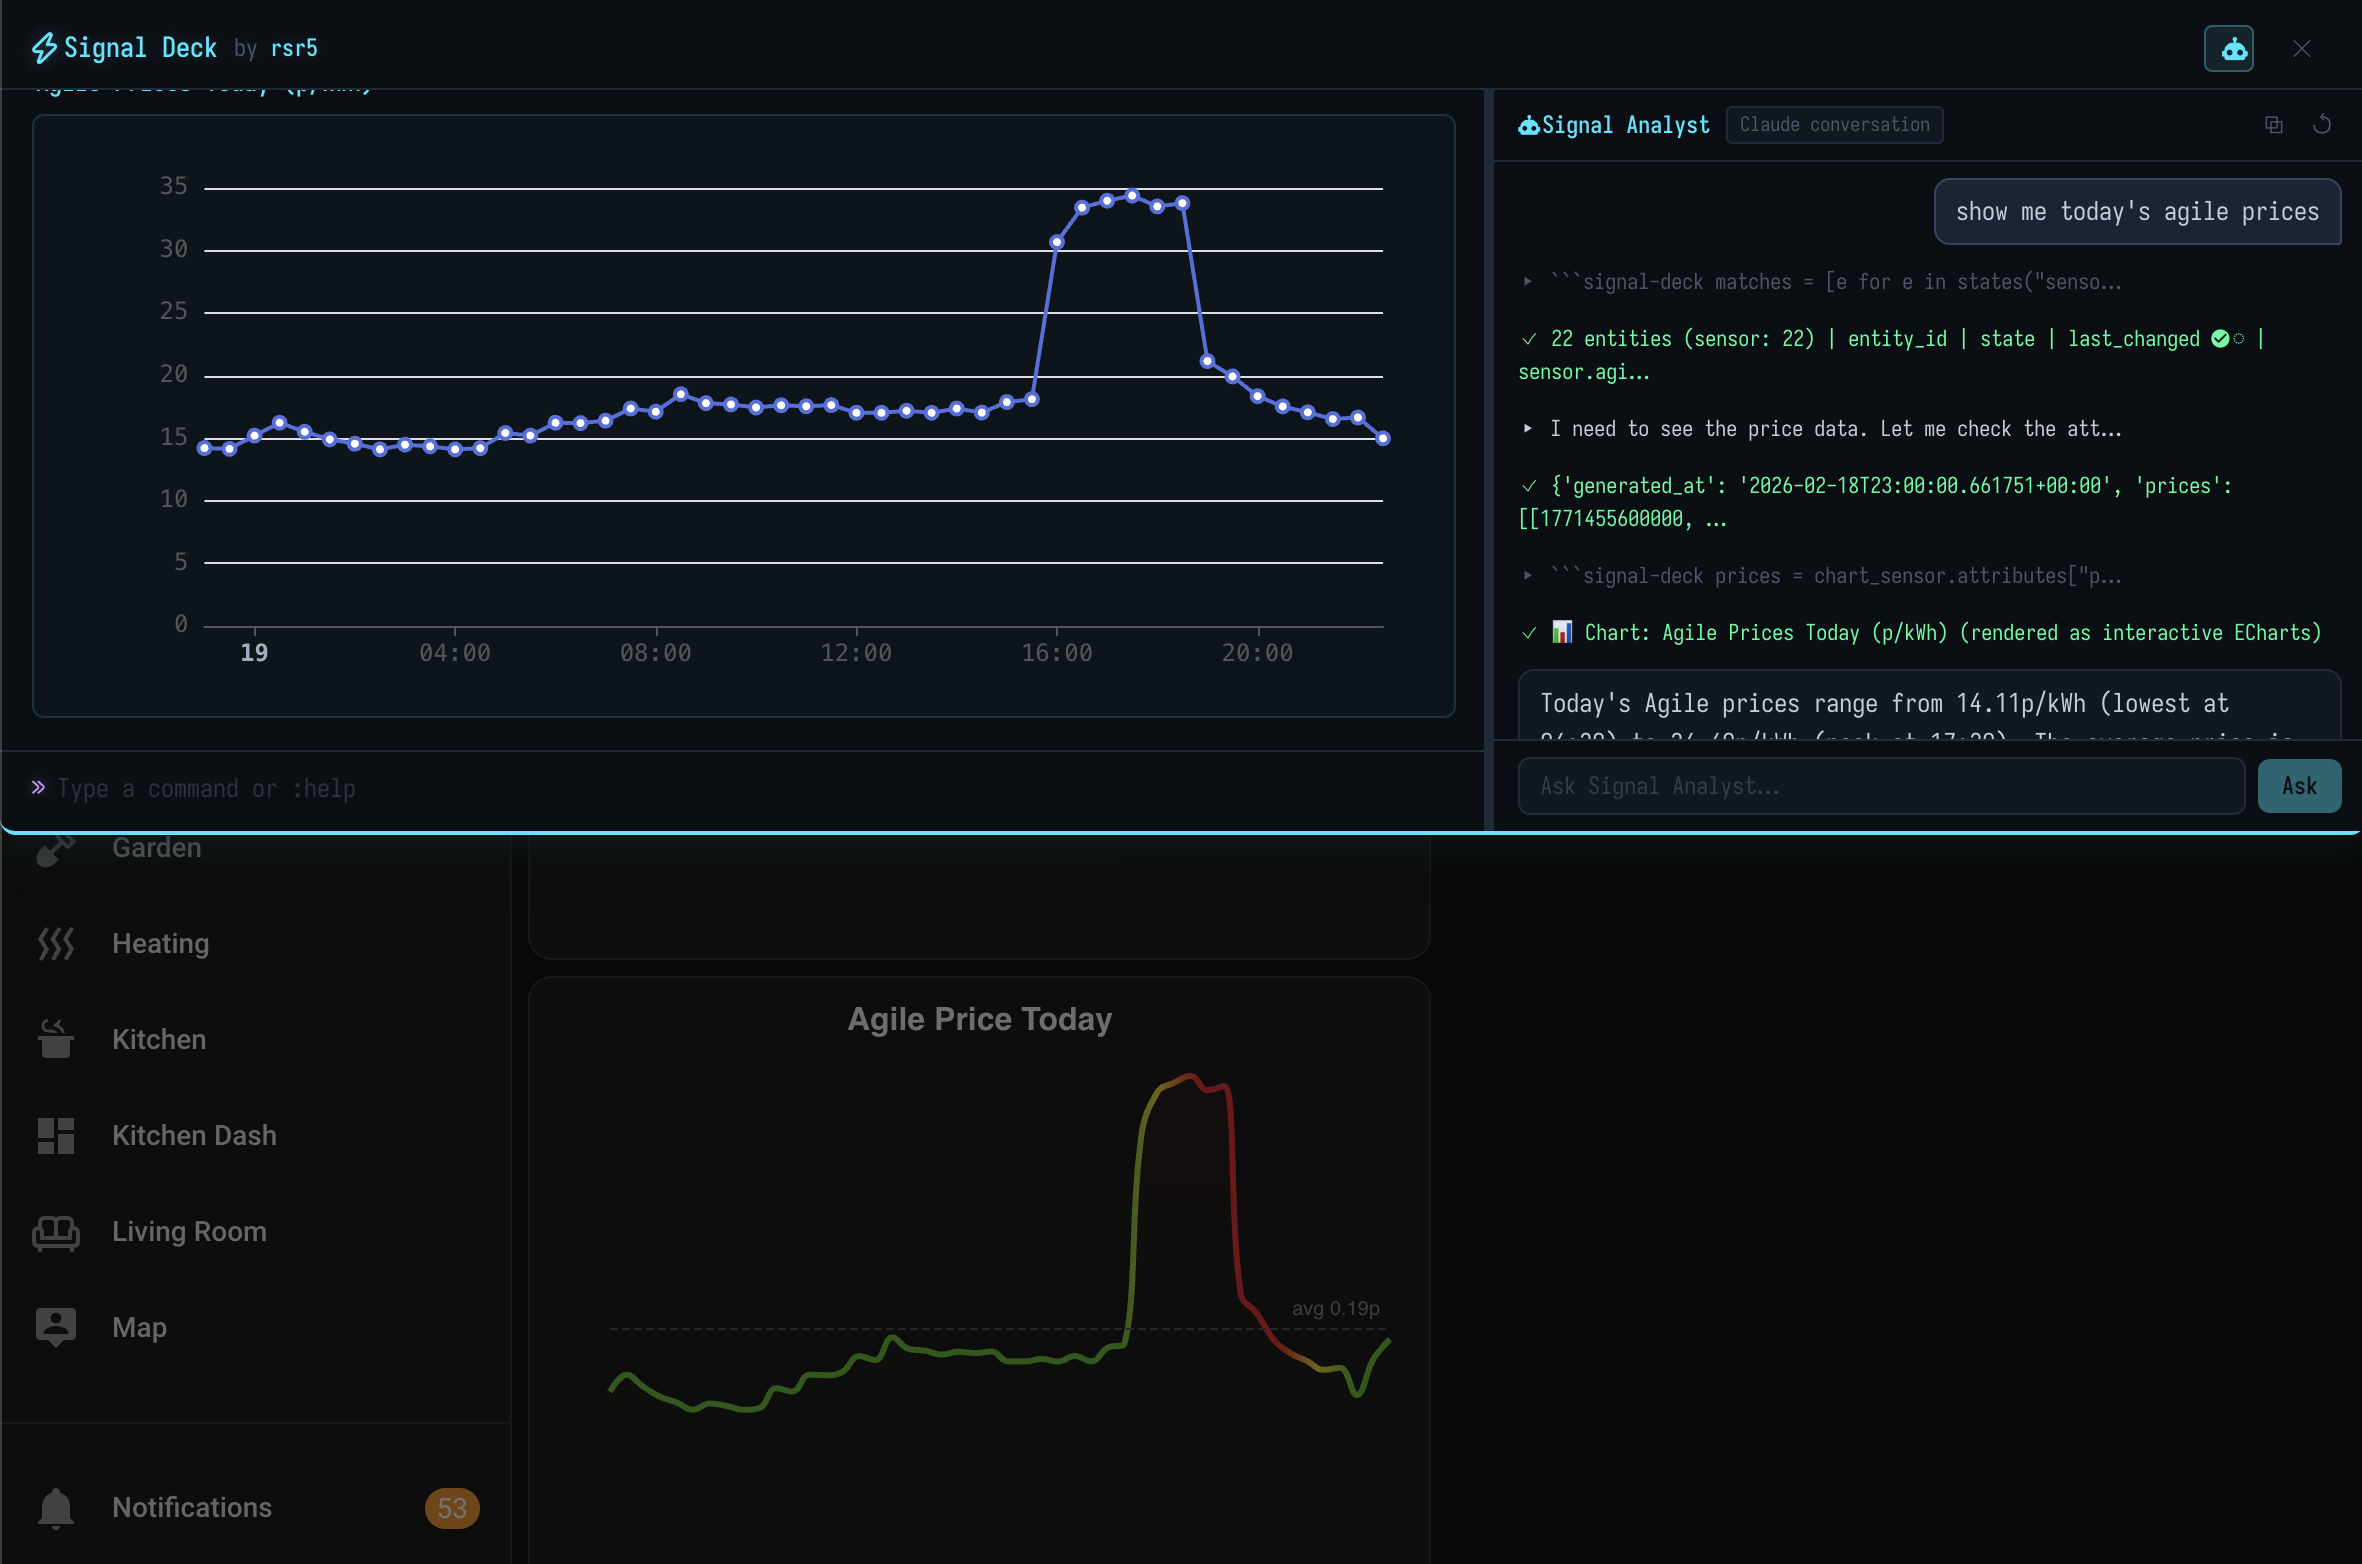
- “Chart the agile electricity prices for today” It pulls the Octopus data and renders an ECharts visualisation
It’s not magic. It’s a well-structured agent loop with a carefully tuned system prompt. But it’s genuinely useful for the kind of exploratory “what’s going on in my house?” questions that are tedious to answer manually.
The dishwasher mystery
Here’s an example that made it click for me.
One evening, Signal Deck showed that dishwasher cycle durations ranged from 14.5 minutes to 150 minutes. That’s a huge spread. I hadn’t noticed because the dishwasher doesn’t have a convenient “last cycle duration” sensor. You’d have to pull the history and do the maths yourself.
The Signal Analyst flagged the 14.5-minute cycle as anomalous and suggested:
“Cycle likely interrupted or dishwasher stopped early.”
Which turned out to be exactly right - someone had opened it mid-cycle.
This is a tiny thing. Nobody was harmed. But it’s the kind of insight that’s invisible in a normal dashboard. You’d never build a dedicated card to monitor dishwasher cycle variance. You’d never write an automation to detect it. But when you can just ask, it surfaces naturally.
This is the moment my house stopped being a collection of dashboards and started being an observability system.
Why this matters
Home Assistant is getting complex. Not slowly - rapidly.
My own setup has Bayesian presence sensors fusing data from multiple sources. mmWave radars doing room-level occupancy. AppDaemon logic controlling lighting scenes based on time, presence, and ambient light. Starlink failover routing with automatic WAN switching. Energy price optimisation that shifts loads based on Octopus Agile rates. Custom dashboards for every room.
And I’m not unusual. The HA community is full of setups like this - or more complex.
At this scale, the traditional debugging approach breaks down. You can’t stare at a dashboard and understand why something happened. There are too many interacting systems, too many state changes per hour, too many automations triggering automations. The logbook shows what happened but not why. The history graphs show individual signals but not correlations.
What you need is observability tooling. The same kind of thing that SREs use to debug distributed systems - the ability to query, correlate, and explore. To ask “what changed in the last hour?” and get a real answer.
That’s what Signal Deck is trying to be. Not a better dashboard. An instrument.
Why WebAssembly
A reasonable question: why not just run Python on the server?
Because I wanted Signal Deck to have zero infrastructure requirements. No Docker container, no add-on, no Python virtualenv on the HA host. You install a Lovelace card resource and you’re done.
WASM makes this possible. The Python runtime, the Rust shell engine, and all the logic run in the browser. The only network traffic is the standard HA WebSocket API - the same connection your dashboard already uses.
This also means Signal Deck is safe by default. The Python sandbox can’t access the filesystem, the network, or anything outside the APIs explicitly exposed to it. Service calls (turning things on and off) require an explicit arm() step with a confirmation dialog. Read-only exploration is completely ungated.
The aesthetic
I’ll be honest - I spent more time on the visual design than is strictly rational.
Signal Deck uses a dark terminal aesthetic with monospace fonts and dense, information-rich layouts. Entity cards are compact. Tables are ASCII-aligned. Charts are auto-themed to match. The whole thing is designed to feel like an engineering instrument - an oscilloscope for your home.
It should make you smile a little bit when you use it. That’s the goal.
Current state
This is an early alpha release. The API will change. There are rough edges. The WASM bundle is large (around 5MB total). Some things that should be fast aren’t yet.
But the core loop works: type Python, see results, explore your home’s state, ask the AI questions, get charts and tables and explanations. I’ve been using it daily on my own dashboard for weeks.
Try it
Signal Deck is open source under the MIT license.
- GitHub: github.com/rsr5/signal-deck
- Documentation: rsr5.github.io/signal-deck
- Install via HACS: Add as a custom repository (category: Dashboard)
If you’ve ever wished you could just query your Home Assistant - poke at it, correlate signals, understand why something happened - give it a try. I’d love to hear what you think.